top
01
Live·#telecom#programming#web-development
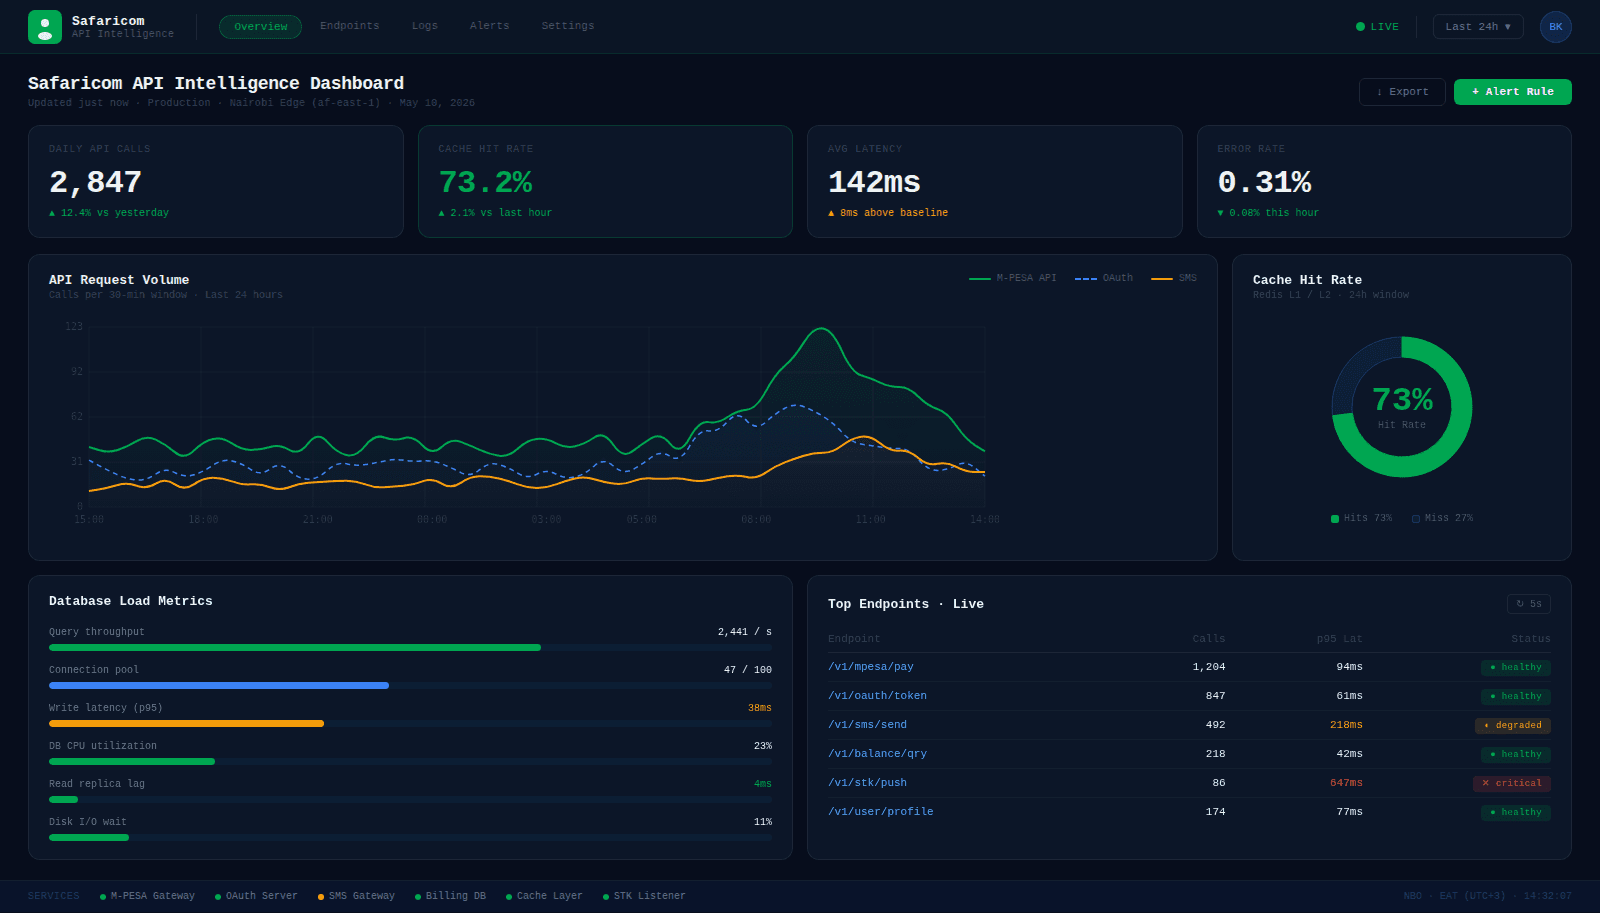
Safaricom API Intelligence DashboardEnterprise Integration Monitor
Project Images
1 / 4
01Overview
API Intelligence Dashboard: A Deep Dive This dashboard provides critical insights into my application's API performance, highlighting the unique challenges and benefits of observability at the integration layer, which differs significantly from standard application monitoring by focusing on inter-service communication health. What It Monitors This API Intelligence Dashboard specifically tracks over 2,000+ daily API calls, providing real-time visibility into endpoint health states (live, degraded, down), per-service throughput, and the crucial split between database and cache traffic. This includes a detailed look at the ~73% cache hit rate. Endpoint Health Tracking The health state model is defined as follows: 'Live' indicates an endpoint is responding within acceptable latency and error thresholds. 'Degraded' signifies increased latency or a minor rise in error rates, suggesting potential issues. 'Down' means the endpoint is unresponsive or consistently returning critical errors. Maintaining visibility across these states is operationally vital for proactive issue resolution and service reliability. Cache vs DB Signal The split between database and cache traffic is a powerful indicator of system efficiency and potential bottlenecks. A high cache hit rate, like the observed ~73%, means a significant portion of requests are being served quickly from memory, reducing load on the primary database. A declining cache hit rate would immediately signal issues with cache performance or increased database strain, prompting an investigation into query performance or caching strategies.
02Impact
Quantifying API Observability: A Portfolio Case Study
When an engineering team gains real-time visibility into over 2,000 daily API calls for the first time, operational efficiency and system reliability fundamentally transform.
Visibility Impact
Centralized Monitoring
Prior to this project, API traffic analysis was fragmented, requiring manual aggregation from disparate log sources. The implementation of a centralized monitoring solution provides a single pane of glass for all API interactions, establishing a definitive source of truth for performance and error analysis.
Proactive vs Reactive
The shift from reactive troubleshooting to proactive detection means endpoint degradation is identified and addressed before it impacts end-users. Operationally, this translates to fewer urgent 'war room' calls, reduced MTTR (Mean Time To Resolve), and a more stable user experience.
💡 This proactive stance allows for planned maintenance and resource allocation, preventing cascading failures during peak loads.
Infrastructure Insight
Cache Performance Signal
The dashboard surfaces a cache hit rate, currently at ~73% cache hit rate. This is an actionable metric, informing decisions about cache invalidation strategies, TTL (Time To Live) configurations, and the potential need for cache scaling or optimization. Understanding this rate directly impacts response times and downstream service load.
💡 A sustained drop in cache hit rate would signal an issue with data freshness, increased load on origin servers, or a potential misconfiguration, making real-time surfacing critical for immediate intervention.
This dashboard replaced a cumbersome process of manually querying disparate log files and running ad-hoc scripts to understand API behavior.
03Built With
ReactJavaScriptNodeJSPostgresPrismaTypeScript
04Case Study
Observability for Enterprise API Integrations
What does operating at scale with over 2,000 daily API calls look like when you're essentially flying blind, lacking critical observability?
The Problem
Before implementing an observability layer, managing enterprise API integrations felt like navigating a complex network of pipes with no pressure gauges or flow meters. Incident response was sluggish, relying heavily on user-reported issues or lengthy manual data correlation. Root cause analysis was pure guesswork, and I found myself constantly firefighting reactive issues rather than preventing them. The critical missing pieces of information included real-time endpoint latency, error rates per service, and the actual volume of traffic flowing through each integration point. Without this data, identifying the source of degradation – whether it was an upstream service, a network bottleneck, or my own application logic – was an exercise in frustration.
⚠️ A single, undetected endpoint degradation can cascade into widespread system instability across an enterprise integration layer.
The Build
Architecture Decisions
I architected the observability dashboard using Node.js and TypeScript. The core principle was to collect granular metrics from API gateway logs and application-level instrumentation. Data points include request latency, response status codes, and payload sizes. This raw data is aggregated in near real-time using a simple in-memory aggregation strategy within the Node.js application, leveraging its asynchronous nature. The aggregated metrics are then pushed to a PostgreSQL database for persistent storage and historical analysis. The frontend, built with React, consumes these metrics via a RESTful API exposed by the Node.js backend, providing a live-updating view of the integration layer's health.
The DB vs Cache Split
Tracking the split between database reads and cache hits at the infrastructure level is crucial. It directly informs performance optimization strategies and capacity planning. Understanding this ratio allows for informed decisions about caching strategies, identifying potential bottlenecks in data retrieval, and prioritizing efforts to improve read performance. A low cache hit rate, for instance, signals an opportunity to enhance caching mechanisms or investigate why data isn't being effectively cached, preventing unnecessary load on the database.
The Outcome
Day-to-day API monitoring is now fully data-driven. I have an average cache hit rate of ~73% surfaced in real time, endpoint degradation is detected proactively before users feel it, and 2,000+ daily API calls have full visibility, enabling swift incident response instead of reactive guesswork.💡 Building observability tooling provides invaluable insights into the real-time behavior and performance characteristics of production systems.